Experimental IR, Laser-Raman Spectra and Quantum Chemical Calculations of Corrosion Inhibitor 2-Amino-5-Ethyl-1,3,4- Thiadiazole
Javeed Ahmad War, Resmi KS, Sheena Mary Y, Panicker CY, Srivastava S Kumar and Sunil Makwane
Javeed Ahmad War1, Resmi KS2, Sheena Mary Y3, Panicker CY2*, Srivastava S Kumar1 and Sunil Makwane1
1Synthetic Organic Chemistry and Molecular Modelling Laboratory, Department of Chemistry, Dr. Hari Singh Gour Central University, Sagar, Madhya Pradesh, India
2Department of Physics, TKM College of Arts and Science, Kollam, Kerala, India
3Department of Physics, Fatima Mata National College, Kollam, Kerala, India
- *Corresponding Author:
- Panicker CY
Department of Physics, TKM College of Arts and Science, Kollam, Kerala, India
Tel: +91-9895370968
E.mail: cyphyp@rediffmail.com
Abstract
IR and Raman spectra of 2-amino-5-ethyl-1,3,4-thiadiazole were recorded and analysed. The vibrational wavenumbers were computed at B3LYP/6-31G(d,p) (6D, 7F) level of theory. The data obtained from wavenumber calculations are used to assign the vibrational bands obtained experimentally. The geometrical parameters of the title compound are in agreement with the XRD results. NBO analysis, HOMO-LUMO, first and second order hyperpolarizability and molecular electrostatic potential results are also reported. From the MEP map it is evident that the negative electrostatic potential regions are mainly localized over the nitrogen atoms of thiadiazole group and are possible sites for electrophilic attack and the positive regions are localized over the amino group as possible sites for nucleophilic attack. Molecular docking studies reveal that the docked ligand title compound forms a stable complex with adenosine receptor and gives a binding affinity value of -7.8 kcal/mole and the results draw us to the conclusion that the compound might exhibit inhibitory activity against adenosine receptor
Keywords
DFT; Thiadiazole; IR; Raman; Molecular docking
Introduction
Thiadiazole, a five membered heterocyclic ring which exists in four isomeric forms viz., 1,3,4-, 1,2,4-, 1,2,5- and 1,2,3-thiadiazole has great importance in biological and industrial fields. Amongst its isomeric forms most attention has been given to 1,3,4-thiadiazole ring system because of its enormous pharmaceutical applications. Thiadiazole derivatives are associated with a wide spectrum of biological activities spanning from antimicrobial to anticancerous activities [1-9]. We have previously synthesized thiadiazole derivatives as anti-inflammatory compounds [5,6]. The industrial applications of 2-amino-5-ethyl-1,3,4-thiadiazole have mostly focused on its exceptional corrosion inhibition properties [10- 12]. Sherif et al. [10,11] have extensively worked on the corrosion inhibition properties of the title compound. Lynch et al. [13] have studied the crystal structure of the title compound. Quantum chemical calculations are now becoming an integral part of the experimental observations and to get a better understanding of the molecular properties quantum chemical calculations are necessary. Some papers have been published which report the DFT calculations on various 1,3,4-thiadiazole derivatives [14]. To best of our knowledge no such calculations have been done on the title compound. Obot et al. [15] have only calculated the HSAB descriptors of the title compound by DFT. Here we report the full vibrational analysis, HOMO-LUMO interactions, NBO and electronic properties of the title compound.
Experimental Details
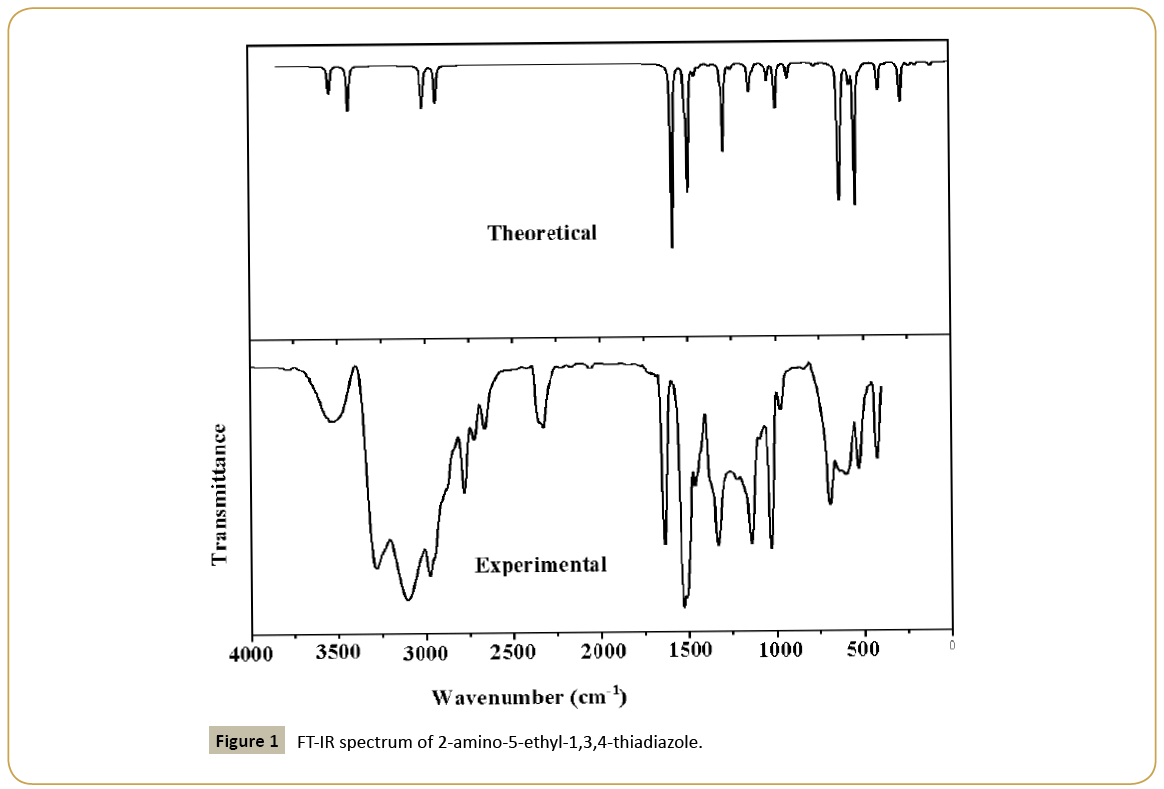
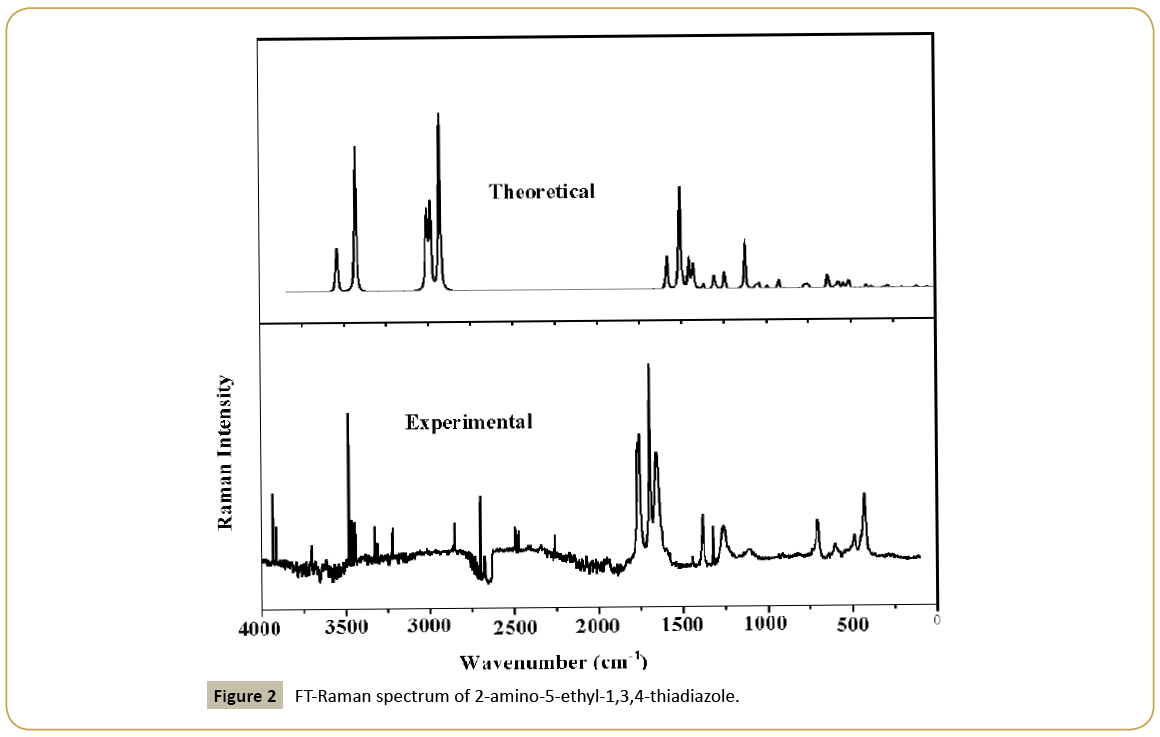
2-amino-5-ethyl-1,3,4-thiadiazole of analytical grade was purchased from Sigma and used as such during experimentation. Infrared spectrum (Figure 1) was recorded on a Fourier transform infrared (FT-IR) spectrophotometer (Shimadzu model 8400 S) with a resolution of 2 cm-1 and in the range 400-4000 cm-1. The Laser-Raman spectrum (Figure 2) was recorded on Renishaw instrument using 633 nm line of Ne laser as excitation wavelength in the range 0-4000 cm-1 with spectral resolution of 2 cm-1.
Computational Details
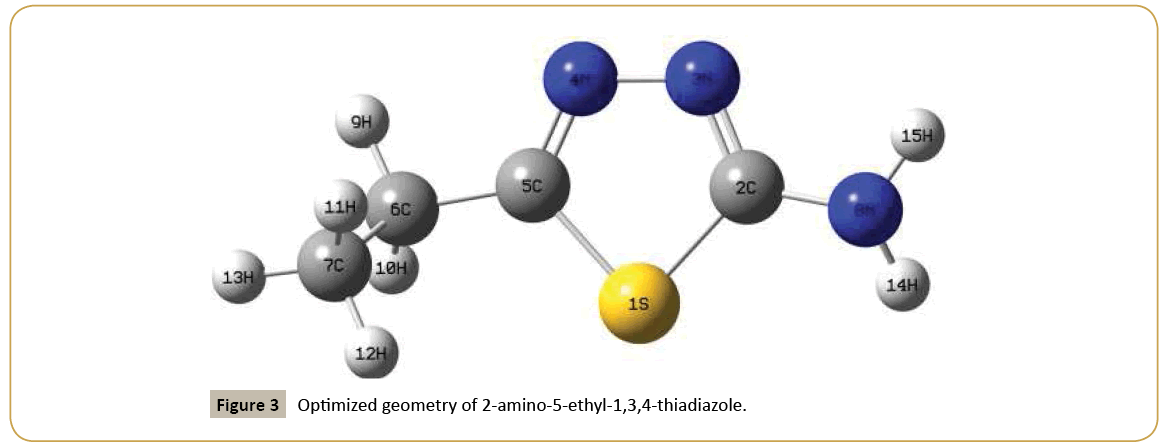
Ab initio calculations on 2-amino-5-ethyl-1,3,4-thiadiazole were carried out using Gaussian 09 software [16] by utilizing Becke’s three parameter hybrid model with the Lee-Yang-Parr correlation functional (B3LYP) method. The 6-31G(d,p) (6D, 7F) basis set was employed to predict the molecular structure and vibrational wavenumbers. Molecular geometries were fully optimized by Berny’s optimization algorithm using redundant internal coordinates. Harmonic vibrational wavenumbers were calculated using analytic second derivatives to confirm the convergence to minima on the potential surface. Then frequency calculations were employed to confirm the structure as minimum points in energy. At the optimized structure (Figure 3) of the examined species, no imaginary wavenumber modes were obtained, proving that a true minimum on the potential surface was found. The DFT method tends to overestimate the fundamental modes; therefore scaling factor (0.9613) has to be used for obtaining a considerably better agreement with experimental data [17]. The observed disagreement between theory and experiment could be a consequence of the anharmonicity and of the general tendency of the quantum chemical methods to overestimate the force constants at the exact equilibrium geometry. The optimized geometrical parameters are given in Table 1. The assignments of the calculated wavenumbers are aided by the animation option of GAUSSVIEW program, which gives a visual presentation of the vibrational modes [18]. The potential energy distribution (PED) is calculated with the help of GAR2PED software package [19].
| Bond lengths (DFT/XRD) (Å) | ||||
|---|---|---|---|---|
| S1-C2 | 1.7627/1.7380 | S1-C5 | 1.7799/1.7385 | |
| C2-N3 | 1.3047/1.3122 | C2-N8 | 1.3754/1.3392 | |
| N3-N4 | 1.3719/1.3893 | N4-C5 | 1.2955/1.2902 | |
| C5-C6 | 1.4994/1.4942 | C6-C7 | 1.5378/1.5133 | |
| C6-H9 | 1.0940/0.9900 | C6-H10 | 1.0970/0.9900 | |
| C7-H11 | 1.0938 /0.9800 | C7-H12 | 1.0946/0.9800 | |
| C7-H13 | 1.0942/0.9800 | N8-H14 | 1.0102/0.8620 | |
| N8-H15 | 1.0127/0.8620 | |||
| Bond angles (DFT/XRD) (ÃÆââ¬Â¹Ãâà ¡) | ||||
| C2-S1-C5 | 85.8/87.2 | S1-C2-N3 | 114.2/113.7 | |
| S1-C2-N8 | 122.3/121.3 | N3-C2-N8 | 123.4/125.0 | |
| C2-N3-N4 | 112.6/111.9 | N3-N4-C5 | 114.5 /113.6 | |
| S1-C5-N4 | 112.9/113.6 | S1-C5-C6 | 122.8/120.7 | |
| N4-C5-C6 | 124.3 /125.6 | C5-C6-C7 | 113.9/114.2 | |
| C5-C6-H9 | 105.9/108.7 | C5-C6-H10 | 109.6 /108.7 | |
| C7-C6-H9 | 110.2/108.7 | C7-C6-H10 | 109.7/108.7 | |
| H9-C6-H10 | 107.6/107.2 | C6-C7-H11 | 110.8/109.5 | |
| C6-C7-H12 | 111.5/109.5 | C6-C7-H13 | 110.3/109.5 | |
| H11-C7-H12 | 108.0/109.5 | H11-C7-H13 | 108.2/109.5 | |
| H12-C7-H13 | 107.8/109.5 | C2-N8-H14 | 116.6/118.9 | |
| C2-N8-H15 | 112.2 /118.9 | H14-N8-H15 | 113.6 /122.0 | |
| Dihedral angles (DFT/XRD) (ÃÆââ¬Â¹Ãâà ¡) | ||||
| C5-S1-C2-N3 | -0.25 | C5-S1-C2-N8 | 0.98767507 | |
| C2-S1-C5-N4 | 0.6/-0.7 | C2-S1-C5-C6 | 1.005630631 | |
| S1-C2-N3-N4 | 0.428571429 | N8-C2-N3-N4 | 175.8/178.6 | |
| S1-C2-N8-H14 | -37.5 | S1-C2-N8-H15 | -171 | |
| N3-C2-N8-H14 | 146.7 | N3-C2-N8-H15 | 13.3 | |
| C2-N3-N4-C5 | 0.8/0.2 | N3-N4-C5-S1 | -2.25 | |
| N3-N4-C5-C6 | 178.3/177.8 | S1-C5-C6-C7 | 67.4/178.7 | |
| S1-C5-C6-H9 | -171.2 | S1-C5-C6-H10 | -56 | |
| N4-C5-C6-C7 | 0.985878199 | N4-C5-C6-H9 | 9.7 | |
| N4-C5-C6-H10 | 125 | C5-C6-C7-H11 | 58.6 | |
| C5-C6-C7-H12 | -61.8 | C5-C6-C7-H13 | 178.4 | |
| H9-C6-C7-H11 | -60.3 | H9-C6-C7-H12 | 179.3 | |
| H9-C6-C7-H13 | 59.5 | H10-C6-C7-H11 | -178.1 | |
| H10-C6-C7-H12 | 61.6 | H10-C6-C7-H13 | -58.3 | |
Table 1: Optimized geometrical parameters (B3LYP/6-31G(d,p) (6D, 7F)) of 2-amino-5-ethyl-1,3,4-thiadiazole with XRD dataa, atom labeling according to Figure 3.
Results and Discussion
IR and Raman spectra
The observed IR, Raman bands and calculated (scaled) wavenumbers and assignments are given in Table 2. The CH3 stretching modes are expected in the region [20] 2900-3050 cm-1. The bands observed at 2950 cm-1 in the IR spectrum and at 3012, 3004, 2933 cm-1 (DFT) are assigned as the stretching modes of the methyl group. Methyl asymmetrical deformations are expected in the region 1460 ± 15 and the symmetrical deformations at 1350 ± 20 cm-1 [20]. The DFT calculation gives 1459, 1453 and 1370 cm-1 as asymmetric and symmetric deformation modes for the title compound. The bands observed at 1449, 1380 cm-1 (IR) and 1462, 1367 cm-1 (Raman) are assigned as the deformation bands of the methyl group. The methyl rocking vibration [20] has been observed at 1050 ± 30 cm-1. The bands observed at 1026 in the IR spectrum, 1058, 1029 cm-1 in the Raman spectrum and 1058, 1039 cm-1 (DFT) are assigned as rocking modes of the methyl group.
| B3LYP/6-31G(d,p) (6D, 7F) | IR | Raman | Assignmentsa | ||
|---|---|---|---|---|---|
| υ(cm-1) | IRI | RA | υ(cm-1) | υ(cm-1) | |
| 3540 | 31.62 | 75.52 | 3546 | 3541 | υasNH2(100) |
| 3428 | 43.33 | 205.42 | - | 3425 | υsNH2(98) |
| 3012 | 23.95 | 42.83 | - | - | υasCH3(100) |
| 3004 | 33.47 | 92.33 | - | - | υasCH3(100) |
| 2985 | 1.16 | 95.8 | 2975 | - | υasCH2(85) |
| 2933 | 23.41 | 98.2 | 2950 | - | υsCH3(80) |
| 2928 | 18.43 | 146.5 | 2903 | 2925 | υsCH2(92) |
| 1585 | 168.03 | 26.7 | 1589 | 1583 | δNH2(65), υC=N(10) |
| 1509 | 32.3 | 84.5 | 1514 | 1507 | υC=N(77), δCH3(11) |
| 1492 | 109.72 | 2.8 | - | 1499 | υC=N(60), δCH3(15) |
| 1459 | 3.09 | 8.34 | - | 1462 | δCH3(63), δCH2(22) |
| 1453 | 7.03 | 19.49 | 1449 | - | δCH3(68), δCH2(17) |
| 1428 | 2.95 | 21.75 | 1430 | 1432 | δCH2(55), δCH3(20) |
| 1370 | 1.43 | 4.08 | 1380 | 1367 | δCH3(75), δCH2 (10) |
| 1308 | 10.85 | 10.08 | 1336 | 1306 | δCH2(60), δNH2(18) |
| 1291 | 79.87 | 1.75 | - | 1289 | δNH2(54), δCH2(21) |
| 1245 | 4.53 | 13.37 | 1223 | 1246 | δCH2(59), δNH2(17) |
| 1143 | 32.75 | 0.53 | 1141 | 1142 | υCN(60), δCH2(19) |
| 1123 | 5.17 | 34.75 | - | - | υNN(48), υCN(19) |
| 1058 | 2.01 | 3.98 | - | 1058 | δCH3(47), υCC(25) |
| 1039 | 14.91 | 4.36 | 1026 | 1029 | δCH3(55), υCC(21) |
| 993 | 42.26 | 2.18 | 975 | - | υCC(37), δCH3(18) |
| 925 | 14.62 | 6.56 | - | 925 | υCC(40), δCH2(20) |
| 771 | 2.84 | 3.08 | 777 | 776 | δCH2(44), τRing(18) |
| 751 | 0.97 | 3.87 | - | 752 | τRing(39), δCH2(17) |
| 636 | 64.25 | 8.96 | 639 | 639 | υCS(44), τRing(23) |
| 628 | 118.95 | 4.64 | - | 626 | υCS(47), τRing(22) |
| 592 | 1.51 | 1.05 | 607 | 589 | τRing(35), υCS(13), |
| γNH2(11) | |||||
| 573 | 22.77 | 6.32 | - | 573 | δRing(41), υCS(15), |
| γNH2(10) | |||||
| 539 | 131.26 | 3.19 | 526 | 538 | γNH2(42), δRing(16) |
| 511 | 4.64 | 6.58 | 489 | 504 | δRing(38), γNH2(22) |
| 408 | 24.2 | 2.37 | 423 | 408 | δRing(43), γNH2(13) |
| 373 | 1.62 | 1.72 | - | 379 | τCH2(40), δRing(14) |
| 298 | 0.81 | 1.07 | - | 298 | τCH3(37), δRing(10), |
| τNH2(12) | |||||
| 279 | 42.21 | 1.89 | - | 281 | τNH2(44), τCH3(12) |
| 228 | 3.28 | 0.63 | - | 233 | τRing(56), τNH2(17) |
| 194 | 2.52 | 0.71 | - | - | τCH3(38), τRing(22) |
| 110 | 3.69 | 1.46 | - | 116 | τRing(41), τCH3(15) |
| 42 | 0.92 | 1.29 | - | - | τRing(39), τCH3(20) |
aυ-stretching; δ-in-plane deformation; γ-out-of-plane deformation; τ-torsion; as-asymmetric; s-symmetric; Ring-thiadiazole ring; IRI-IR Intensity; RA- Raman activity; % of potential energy distribution is given in brackets in the assignment column.
Table 2: Optimized geometrical parameters (B3LYP/6-31G(d,p) (6D, 7F)) of 2-amino-5-ethyl-1,3,4-thiadiazole with XRD dataa, atom labeling according to Figure 3.
The stretching vibrations of the CH2 group (the asymmetric and symmetric stretch) and deformation modes of CH2 group (scissoring, wagging, twisting and rocking modes) appears in the regions 3000 ± 20, 2900 ± 25, 1450 ± 30, 1330 ± 35, 1245 ± 45, 780 ± 55 cm-1 respectively [20,21]. The CH2 stretching modes are observed at 2975, 2903 cm-1 in the IR spectrum, 2925 cm-1 in the Raman spectrum and at 2985, 2928 cm-1 theoretically. The deformation modes of CH2 are assigned at 1430, 1336, 1223, 777 cm-1 in the IR spectrum, 1432, 1306, 1246, 776 cm-1 in the Raman spectrum and 1428, 1308, 1245, 771 cm-1 theoretically as expected [20].
The NH2 stretching modes are observed at 3546 cm-1 in the IR spectrum, 3541, 3425 cm-1 in the Raman spectrum and at 3540, 3428 cm-1 theoretically, which are expected in the region 3360–3540 cm-1 [20]. The NH2 deformations are expected in the regions 1610 ± 30 (scissoring), 1195 ± 90 (rocking/twisting mode) and 645 ± 65 cm-1 (wagging) [20]. For the title compound, these deformation modes are observed at 1589, 526 cm-1 in the IR spectrum, 1583, 1289, 538 cm-1 in the Raman spectrum and at 1585, 1291, 539 cm-1 theoretically as expected. The torsion NH2 mode is expected in the range 355 ± 65 cm-1 [20] and the band at 279 (DFT) and 281 cm-1 (Raman) is assigned as this mode.
The C=N stretching bands [22] are expected in the range 1450- 1550 cm-1 and for the title compound, the bands observed at 1514 cm-1 in the IR and 1507, 1499 cm-1 in Raman spectrum are assigned as C=N stretching modes. DFT calculations give these modes at 1509 and 1492 cm-1. Haress et al. [23] reported υC=N bands at 1540, 1520 cm-1 in the Raman spectrum, at 1535, 1520 in the IR spectrum and at 1531, 1516 cm-1 (DFT) for oxadiazole compound.
For the title compound C-S stretching modes are observed at 639 cm-1 in the IR spectrum, 639, 626 cm-1 in the Raman spectrum and at 636, 628 cm-1 theoretically as expected [20]. The C-S stretching modes are reported at 641 (IR), 645 (Raman) and at 704, 640 cm-1 theoretically by Mary et al. [24]. The deformation modes of the thiadiazole ring are also identified and assigned (Table 2). Most of the vibrations are not pure but contains significant contributions from other modes also.
Geometrical parameters
For the title compound the C-N bond lengths (DFT/XRD) are C2-N3= 1.3047/1.3122, C5-N4 = 1.2955/1.2902 and C2-N8 = 1.3754/1.3392 Å. In the present case the C-S bond lengths (DFT/XRD) are 1.7627/1.7380 and 1.7799/1.7385 Å while the reported CS bond lengths are 1.7822, 1.7782 (DFT) and 1.7602, 1.7535 Å (XRD) [24]. The C5-S1-C2 bond angle (DFT/XRD) of the title compound is 85.8/87.2°. Minitha et al. [25] reported this angle as 99.4/101.0° and Endredi et al. [26] reported this value as 96.1, 97.9 and 98°. At C5 position, the bond angles (DFT/XRD) are S1-C5-N4 = 112.9/113.6, S1-C5-C6 = 122.8/120.7 and N4-C5-C6 =124.3/125.6° and this asymmetry of the bond angle values is due to the interaction between the CH2CH3 group and the ring. Similarly at C2 position, the bond angles (DFT/XRD) N3-C2-N8 is increased by 3.4/5.0, S1-C2-N8 is increased by 2.3/1.3 and N3-C2-S1 is reduced by 5.8/6.3° from 120° and this is due to the interaction between the ring and NH2 group.
Frontier molecular orbital analysis
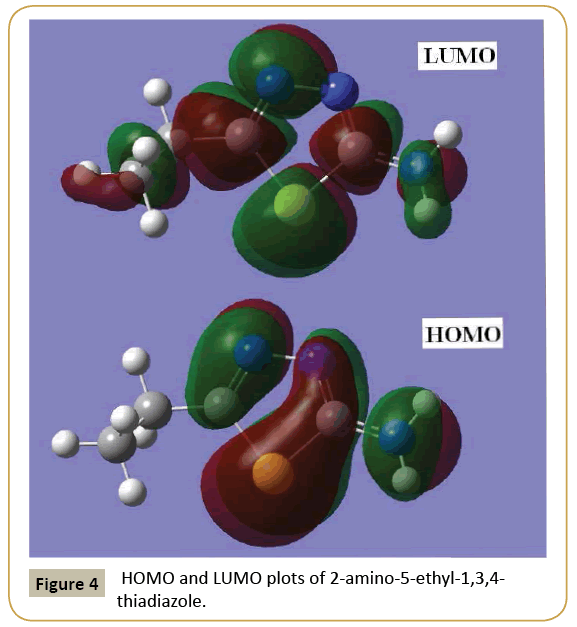
Knowledge of the highest occupied molecular orbital (HOMO) and lowest unoccupied molecular orbital (LUMO) and their properties such as their energy is very useful to gauge the chemical reactivity of the molecule. The ability of the molecule to donate an electron is associated with the HOMO and the characteristic of the LUMO is associated with the molecule’s electron affinity. The HOMO and LUMO energies are very useful for physicists and chemists and are very important terms in quantum chemistry [27]. The electronic absorption corresponds to the transition from the ground to the first excited state and is mainly described by one electron excitation from the HOMO to the LUMO. The pictorial representation of the HOMO and the LUMO is shown in Figure 4. The HOMO lies at -7.741 eV and whereas the LUMO is located at -3.160 eV and is delocalized over the entire molecule with the exception, of the ethyl group of the ester function. This shows that an eventual charge transfer occurs within the molecule, and that the frontier orbital energy gap is 4.581 eV. The energy gap explains the eventual charge transfer interaction within the molecule and is useful in determining molecular electrical transport properties. Both the HOMO and LUMO orbital are the main orbitals that decide on the chemical stability of the molecule. By using the HOMO and LUMO energy values, the global chemical reactivity descriptors such as hardness, chemical potential, electro-negativity and electrophilicity index as well as local reactivity can be defined [28]. Pauling introduced the concept of electro-negativity as the power of an atom in a molecule to attract electrons to it. Hardness (η), chemical potential (μ) and electro-negativity (χ) are defined using Koopman’s theorem as η = (I-A)/2 = 2.291 eV, μ= -(I+A)/2 = -5.451 eV and χ = (I+A)/2 = 5.451 eV, where A and I are the ionization potential and electron affinity of the molecule. I= -EHOMO = 7.741 eV and A = -ELUMO = 3.160 eV. One can also relate the stability of the molecule to hardness, which means that the molecule with a lower energy gap shows higher reactivity. Parr et al. [29] have defined a descriptor to quantify the global electrophilic power of the molecule as the electrophilicity index, ω=μ2/2η=6.485 eV. The usefulness of this new reactivity quantity has been demonstrated recently in understanding the toxicity of various pollutants in terms of their reactivity and site selectivity [30].
Nonlinear optical properties
Nonlinear optics deals with the interaction of applied electromagnetic fields in various materials to generate new electromagnetic fields, altered in wavenumber, phase, or other physical properties [31]. Quantum chemical calculations have been shown to be useful in the description of the relationship between the electronic structure of systems and its NLO response [32]. The computational approach allows the determination of molecular NLO properties as an inexpensive way to design molecules by analyzing their potential before synthesis and to determine high order hyperpolarizability tensors of the molecules. The first order hyperpolarizability of the title compound is calculated and is found to be 2.368 × 10⁻³⁰ esu. Minitha et al. [25] reported the first hyperpolarizability of a phenothiazine derivate as 2.5 × 10- 30 esu. The calculated hyperpolarizability of the title compound is 18.22 times that of the standard NLO material urea (0.13 × 10⁻³⁰ esu) [33]. The theoretical second order hyperpolarizability was calculated using the Gaussian09 software and is equal to -2.519 × 10-37 e.s.u. We conclude that the title compound and its derivatives are an attractive object for future studies of nonlinear optical properties.
Molecular electrostatic potential
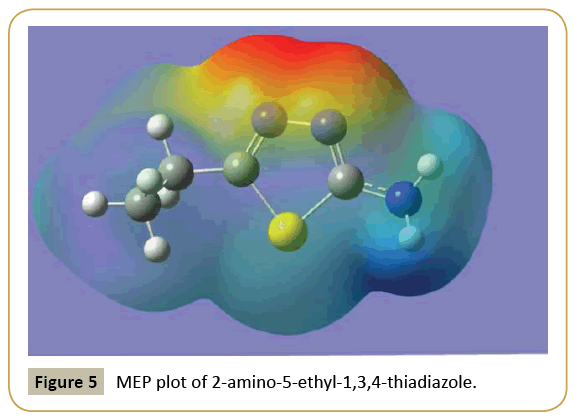
Molecular electrostatic potential (MEP) at a point in space around a molecule gives information about the net electrostatic effect produced at that point by the total charge distribution over the molecule [34]. Moreover, the MEP surface helps to predict the reactivity of a wide variety of chemical systems in both electrophilic and nucleophilic reactions, the study of biological recognition processes and hydrogen bonding interactions [35]. It also provides visual understanding of the relative polarity of the molecule. An electron density iso-surface mapped with electrostatic potential surface depicts the size, shape, charge density and reactive sites of the molecule. The different values of the electrostatic potential at the surface are represented by different colors; red represents regions of most electro negative electrostatic potential, blue represents regions of most positive electrostatic potential and green represents regions of zero potential. The electrostatic potential increases in the order red<orange<yellow<green<blue [34]. To predict reactive sites for electrophilic and nucleophilic attack in the investigated molecule, the MEP surface is plotted for the title compound at DFT level [36]. Figure 5 shows the electrostatic potential contour map of the title compound. The negative electrostatic potential corresponds to an attraction of a proton by the aggregate electron density in the molecule (shades of red and yellow) and the positive electrostatic potential corresponds to the repulsion of a proton by the nuclei (shades of blue). As can be seen from the Figure 5, the negative electrostatic potential regions are mainly localized over the nitrogen atoms of thiadiazole group and are possible sites for electrophilic attack. The positive regions are localized over the amino group as possible sites for nucleophilic attack.
Natural bond orbital analysis
The natural bond orbitals (NBO) calculations were performed using NBO 3.1 program [37] as implemented in the Gaussian09 package at the DFT/B3LYP level in order to understand various second-order interactions between the filled orbitals of one subsystem and vacant orbitals of another subsystem, which is a measure of the intermolecular delocalization or hyper conjugation. NBO analysis provides the most accurate possible 'natural Lewis structure' picture of 'j' because all orbital details are mathematically chosen to include the highest possible percentage of the electron density. A useful aspect of the NBO method is that it gives information about interactions of both filled and virtual orbital spaces that could enhance the analysis of intra and inter molecular interactions. The second-order Fock- matrix was carried out to evaluate the donor-acceptor interactions in the NBO basis. The interactions result in a loss of occupancy from the localized NBO of the idealized Lewis structure into an empty non- Lewis orbital. For each donor (i) and acceptor (j) the stabilization energy (E2) associated with the delocalization i → j is determined as
E (2) =  =
= 
qi → donor orbital occupancy
Ei, Ej → diagonal elements
Fij → the off diagonal NBO Fock matrix element
In NBO analysis large E (2) value shows the intensive interaction between electron-donors and electron-acceptors, and greater the extent of conjugation of the whole system, the possible intensive interaction are given in Table 3. The second-order perturbation theory analysis of Fock-matrix in NBO basis shows strong intramolecular hyper conjugative interactions are formed by orbital overlap between n(S), n(N) and σ*(C-N), π*(C-N), σ*(C-S) bond orbitals which result in intra-molecular charge transfer causing stabilization of the system.
| Donor(i) Type | ED/e | Acceptor(j) Type | ED/e | E(2)a | E(j)-E(i)b | F(i,j)c | ||
|---|---|---|---|---|---|---|---|---|
| S1-C2 | s | 1.97752 | N4-C5 | s* | 0.0303 | 1.3 | 1.24 | 0.036 |
| - | - | - | C5-C6 | s* | 0.02669 | 3.84 | 1.08 | 0.057 |
| S1-C5 | s | 1.97702 | C2-N3 | s* | 0.03357 | 1.28 | 1.2 | 0.035 |
| - | - | - | C2-N8 | s* | 0.0271 | 5.51 | 1.09 | 0.069 |
| C2-N3 | s | 1.99044 | C2-N8 | s* | 0.0271 | 1.35 | 1.32 | 0.038 |
| - | p | 1.90002 | C2-N3 | p* | 0.37484 | 1.08 | 0.32 | 0.018 |
| - | - | - | N4-C5 | p* | 0.28012 | 13.33 | 0.33 | 0.063 |
| C2-N8 | s | 1.99263 | C2-N3 | s* | 0.03357 | 1.58 | 1.4 | 0.042 |
| - | - | - | N3-N4 | s* | 0.01445 | 2.14 | 1.25 | 0.046 |
| N4-C5 | s | 1.99065 | C5-C6 | s* | 0.02669 | 2.16 | 1.3 | 0.048 |
| - | p | 1.93031 | C2-N3 | p* | 0.37484 | 9.53 | 0.32 | 0.054 |
| - | - | - | C6-C7 | s* | 0.0107 | 2.72 | 0.7 | 0.039 |
| C5-C6 | s | 1.98138 | N3-N4 | s* | 0.01445 | 3.54 | 1.06 | 0.055 |
| - | - | - | N4-C5 | s* | 0.0303 | 2.37 | 1.24 | 0.048 |
| LPS1 | s | 1.98403 | C2-N3 | s* | 0.03357 | 2.31 | 1.23 | 0.048 |
| - | - | - | N4-C5 | s* | 0.0303 | 1.75 | 1.25 | 0.042 |
| - | p | 1.68614 | C2-N3 | p* | 0.37484 | 26.78 | 0.25 | 0.075 |
| - | - | - | N4-C5 | p* | 0.28012 | 23.16 | 0.27 | 0.071 |
| LPN3 | s | 1.89487 | S1-C2 | s* | 0.08474 | 16.38 | 0.55 | 0.085 |
| - | - | - | C2-N8 | s* | 0.0271 | 2 | 0.81 | 0.037 |
| - | - | - | N4-C5 | s* | 0.0303 | 5.77 | 0.95 | 0.067 |
| LPN4 | s | 1.89381 | S1-C5 | s* | 0.09192 | 17.37 | 0.54 | 0.087 |
| - | - | - | C2-N3 | s* | 0.03357 | 5.89 | 0.93 | 0.067 |
| - | - | - | C5-C6 | s* | 0.02669 | 1.12 | 0.78 | 0.027 |
| LPN8 | s | 1.82219 | C2-N3 | s* | 0.03357 | 1.15 | 0.87 | 0.029 |
| - | - | - | C2-N3 | p* | 0.37484 | 34.44 | 0.31 | 0.096 |
aE(2) means energy of hyper-conjugative interactions (stabilization energy in kJ/mol)
bEnergy difference (a.u) between donor and acceptor i and j NBO orbitals
cF(i,j) is the Fock matrix elements (a.u) between i and j NBO orbitals
Table 3: Second-order perturbation theory analysis of Fock matrix in NBO basis corresponding to the intramolecular bonds of the title compound.
There occurs an intra-molecular hyper-conjugative interaction of C2-N3 from S1 of n1(S1)→ σ*(C2-N3) which increases electron density (ED) (0.03357e) and weakens the respective bonds C2-N3 leading to stabilization of 2.31 KJ/moland a strong intra-molecular hyper conjugative interaction C2-N3 from S1 of n2(S1)→π*(C2-N3) which increases ED (0.37484e) and weakens the respective bonds C2-N3 leading to stabilization of 26.78 KJ/mol. Another hyper-conjugative interaction of S1-C2 from N3 of n1(N3)→σ*(S1-C2) which increases ED (0.08474e) and weakens the respective bonds S1-C2 leading to stabilization of 16.38 KJ/mol. There occurs an intra-molecular hyper conjugative interaction of S1-C5 from N4 of n1(N4)→σ*(S1-C5) which increases ED (0.09192e) and weakens the respective bonds S1-C5 leading to stabilization of 17.37 KJ/mol and also a strong intra-molecular hyper conjugative interaction of C2-N3 from N8 of n1(N8)→π*(C2-N3) which increases ED (0.37484e) and weakens the respective bonds C2-N3 leading to stabilization of 34.44 KJ/mol.
These interactions are observed as an increase in electron density in C-C anti-bonding orbital that weakens the respective bonds. The hyper conjugative interaction energy was deduced from the second-order perturbation approach. Delocalization of electron density between occupied Lewis-type (bond or lone pair) NBO orbitals and formally unoccupied (anti bond or Rydberg) non- Lewis NBO orbitals corresponds to a stabilizing donor–acceptor interaction. The NBO analysis describes the bonding in terms of the natural hybrid orbital n2(S1), which occupy a higher energy orbital (-0.25734 a.u.) with considerable p-character (99.98%) and low occupation number (1.68614) and the other n1(S1) occupy a lower energy orbital (-0.66801 a.u.) with p-character (33.32%) and high occupation number (1.98403). Thus, a very close to pure p-type lone pair orbital participates in the electron donation to then n1(S1)→σ*(C2-N3), n2(S1)→*(C2-N3), n1(N3)→σ*(S1-C2), n1(N4)→σ*(S1-C5) and n1(N8)→π*(C2-N3) interactions in the compound. The results are tabulated in Table 4.
| Bond(A-B) | ED/ea | EDA% | EDB% | NBO | s% | p% |
|---|---|---|---|---|---|---|
| sS1-C2 | 1.97752 | 47.51 | 52.49 | 0.6893(sp5.06)S+ | 16.4 | 83.6 |
| - | -0.6636 | 0.7245(sp2.46)C | 28.83 | 71.17 | ||
| sS1-C5 | 1.97702 | 49.55 | 50.45 | 0.7039(sp4.78)S+ | 17.21 | 82.79 |
| - | -0.645 | 0.7103(sp2.92)C | 25.48 | 74.52 | ||
| sC2-N3 | 1.99044 | 42.42 | 57.58 | 0.6513(sp1.71)C+ | 36.94 | 63.06 |
| - | -0.8763 | 0.7588(sp1.71)C | 36.84 | 63.16 | ||
| pC2-N3 | 1.90002 | 40.59 | 59.41 | 0.6371(sp99.99)C+ | 0.01 | 99.99 |
| - | -0.3244 | 0.7708(sp99.99)N | 0.02 | 99.98 | ||
| sC2-N8 | 1.99263 | 40.58 | 59.42 | 0.6370(sp1.94)C+ | 34.02 | 65.98 |
| - | -0.8434 | 0.7708(sp1.79)N | 35.83 | 64.17 | ||
| sN4-C5 | 1.99065 | 58.48 | 41.52 | 0.7647(sp1.53)N+ | 39.49 | 60.51 |
| - | -0.8871 | 0.6444(sp1.85)C | 35.04 | 64.96 | ||
| pN4-C5 | 1.93031 | 54.71 | 45.29 | 0.7397(sp1.00)N+ | 0.01 | 99.99 |
| - | -0.3235 | 0.6730(sp99.99)C | 0.01 | 99.99 | ||
| sC5-C6 | 1.98138 | 51.04 | 48.96 | 0.7144 (sp1.54)C+ | 39.38 | 60.62 |
| - | -0.6577 | 0.6997(sp2.79)C | 26.37 | 73.63 | ||
| n1S1 | 1.98403 | sp0.50 | 66.68 | 33.32 | ||
| - | -0.668 | - | - | - | ||
| n2S1 | 1.68614 | sp99.99 | 0.02 | 99.98 | ||
| - | -0.2573 | - | - | - | ||
| n1N3 | 1.89487 | sp1.67 | 37.35 | 62.65 | ||
| - | -0.3725 | - | - | - | ||
| n1N4 | 1.89381 | sp1.83 | 35.26 | 64.74 | ||
| - | -0.3687 | - | - | - | ||
| n1N8 | 1.82219 | sp7.57 | 11.67 | 88.33 | ||
| - | -0.3081 | - | - | - |
aED/e is expressed in a.u.
Table 4: NBO results showing the formation of Lewis and non-Lewis orbitals.
Electronic absorption spectra
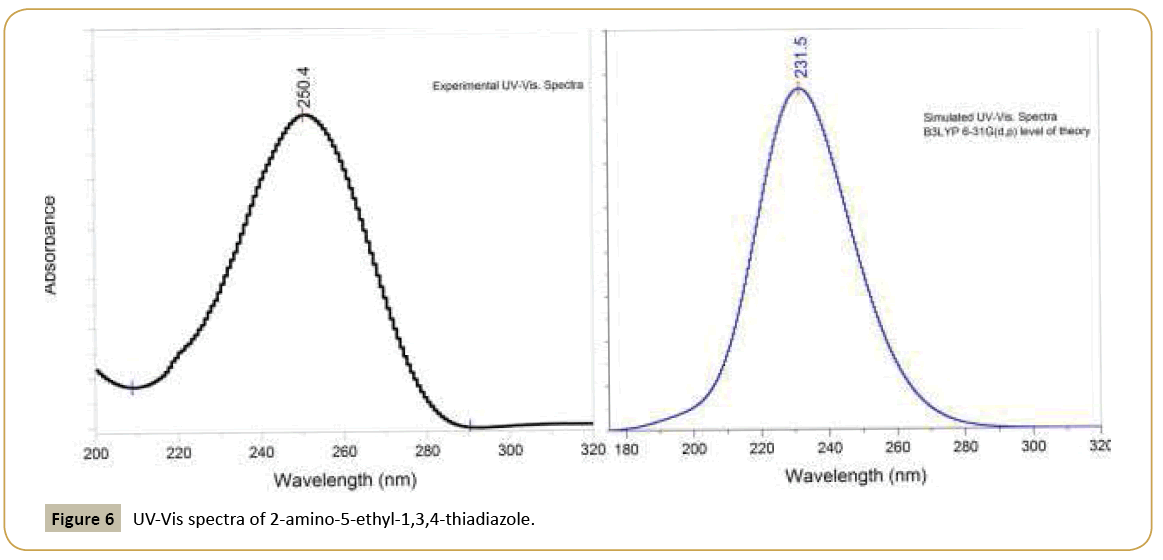
Electronic transitions are usually classified according to the orbitals engaged or to specific parts of the molecule involved. Common types of electronic transitions in organic compounds are π-π*, n–π* and π*(acceptor)-π(donor). The UV–visible bands in 2-amino-5-ethyl-1,3,4-thiadiazole are observed at 250.4, 234.5 nm. Observed band at 234.5 nm is due to the π- π* transition from HOMO to LUMO. The more intense band observed at 250.4 nm belonged to the dipole-allowed π-π* transition. In order to understand the electronic transitions of the title compound, TDDFT calculation on electronic absorption spectrum in vacuum was performed. TD-DFT calculation is capable of describing the spectral features of the title compound because of the qualitative agreement of line shape and relative strength as compared with experiment. The absorption spectra of organic compounds stem from the ground-to-excited state vibrational transition of electrons. The intense band in the UV range of the electronic absorption spectrum is observed at 250.4 nm, which is indicating the presence of chromophoric NH2 in the ring. The calculated two lowest-energy transitions of the molecule from TD-DFT method and the observed electronic transitions are listed in Table 5. From the Table 5 the calculated energy transitions are red shifted from the experimental value, because these bands are observed in gas phase without considering the solvent effect. The experimental and theoretical UV spectra are given in Figure 6.
| Excitation | CI expansion coefficient | Energy (eV) | Wavelength calc.(nm) | Wavelength expt.(nm) | Oscillator strength(f) |
|---|---|---|---|---|---|
| Excited state 1 | |||||
| 34→36 | 0.50495 | 5.0095 | 243.13 | 250.4 | 0.0433 |
| Excited state 2 | |||||
| 33→35 | 0.64943 | 5.2018 | 238.35 | - | 0.0007 |
| Excited state 3 | |||||
| 34→35 | 0.54016 | 5.405 | 229.39 | 234.5 | 0.1625 |
| Excited state 4 | |||||
| 33→36 | 0.5702 | 6.0213 | 205.91 | - | 0.0073 |
| Excited state 5 | |||||
| 31→35 | 0.69717 | 6.1893 | 200.32 | - | 0.004 |
| Excited state 6 | |||||
| 34→37 | 0.49659 | 6.3646 | 194.8 | - | 0.0041 |
33, 34 etc. are the numbering of orbitals
CI- Configuaration Interaction
Table 5: Calculated electronic absorption spectrum of 2-amino-5-ethyl-1,3,4-thiadiazole using TD-DFT/B3LYP/6-31G(d,p) (6D, 7F).
| Mode | Affinity (kcal/mol) | Distance from best mode (Å) | |
|---|---|---|---|
| RMSD l.b. | RMSD u.b. | ||
| 1 | -7.8 | 0 | 0 |
| 2 | -7.8 | 2.004 | 3.123 |
| 3 | -7.6 | 7.068 | 10.567 |
| 4 | -7.2 | 7.15 | 12.001 |
| 5 | -7.1 | 4.346 | 9.674 |
| 6 | -7.1 | 16.466 | 17.917 |
| 7 | -6.9 | 10.455 | 12.932 |
| 8 | -6.9 | 1.121 | 2.912 |
| 9 | -6.7 | 2.113 | 2.985 |
Table 6: The binding affinity values of different poses of the title compound predicted by Autodock Vina.
Molecular docking
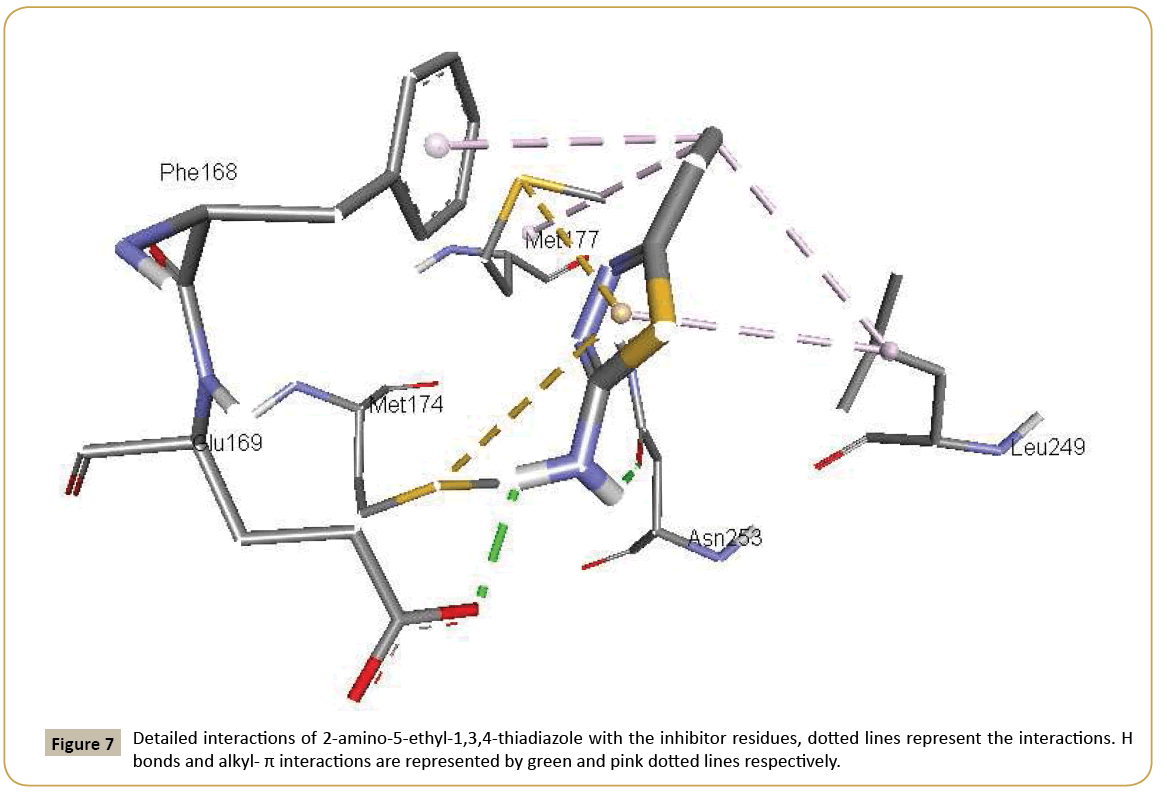
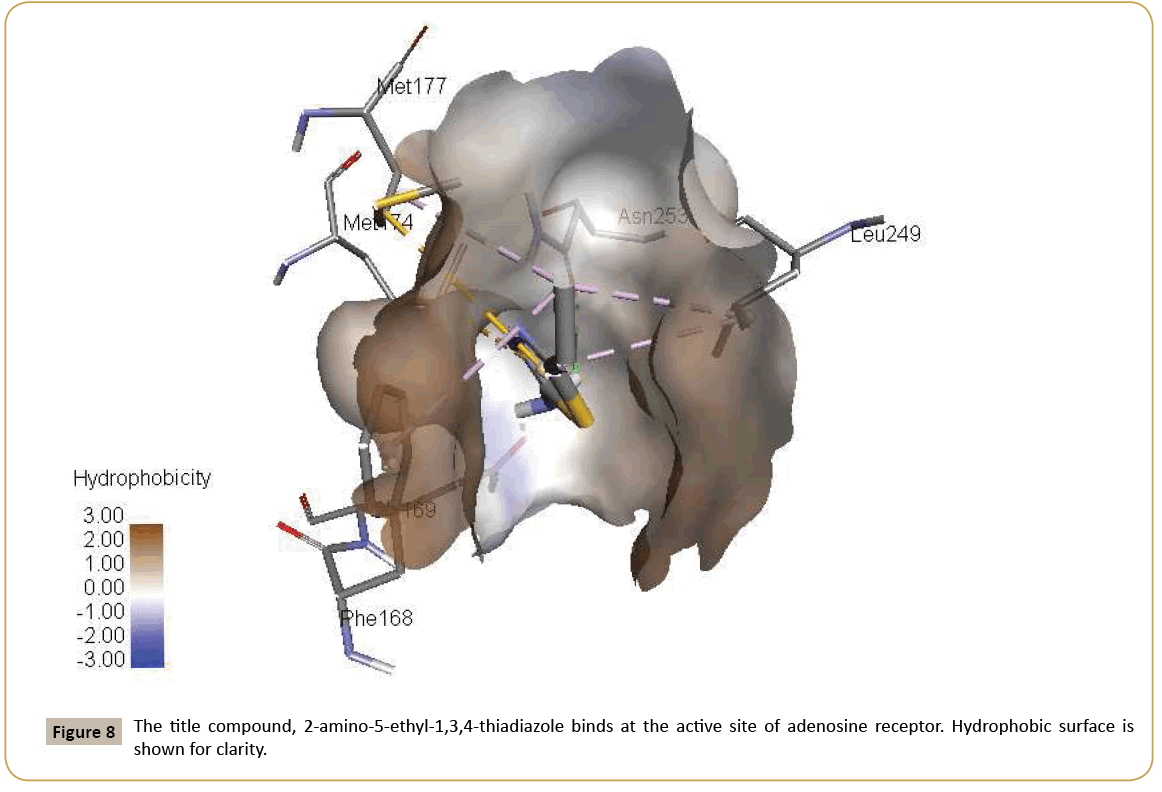
Adenosine receptors are a target of great interest because of their pathological involvement in numerous diseases. Activation of adenosine receptors is beneficial in many conditions like epilepsy, pain, cancer, etc. whereas inhibition of adenosine receptors is helpful in Parkinson’s disease, Alzheimer’s disease, asthma, diabetes and cancer [38-40]. 2-aminothiophene substituents are found in modulation of adenosine receptors [41]. Aurelio et al. published 2-aminothiophene derivatives as adenosine receptor modulators [42]. Aminothiazole compounds as adenosine receptor antagonists have been reported to show high affinity and selectivity [43,44]. Thiazoles act as ligands towards a great variety of biological substrates, and this being so they are very interesting functional groups for application in medicinal chemistry. A series of chromone–thiazole hybrids are potential ligand for human adenosine receptors [45]. Some thiazole– thiophene conjugate structure is favourable for the interaction with adenosine receptors [46]. High resolution crystal structure of adenosine receptor was downloaded from the protein data bank website (PDB ID: 2YDO). All molecular docking calculations were performed on AutoDock-Vina software [47]. The 3D crystal structure of adenosine receptor was obtained from Protein Data Bank. The protein was prepared for docking by removing the cocrystallized ligands, waters and co-factors. The Auto Dock Tools (ADT) graphical user interface was used to calculate Kollman charges and polar hydrogens. The ligand was prepared for docking by minimizing its energy at B3LYP/6-31G(d,p) (6D, 7F) level of theory. Partial charges were calculated by Geistenger method. The active site of the enzyme was defined to include residues of the active site within the grid size of 40 Å × 40 Å × 40 Å. The most popular algorithm, Lamarckian Genetic Algorithm (LGA) available in Autodock was employed for docking. The docking protocol was tested by extracting co-crystallized inhibitor from the protein and then docking the same. The docking protocol predicted the same conformation as was present in the crystal structure with RMSD value well within the reliable range of 2 Å [48]. Amongst the docked conformations, one which binds well at the active site was analyzed for detailed interactions in Discover Studio Visualizer 4.0 software. The ligand binds at the active site of the substrate (Figures 7 and 8) by weak non-covalent interactions. Amino acids Asn153 and Glu169 form H-bond with NH2 group. Phe168 and Met177 amino acids give hydrophobic interaction with CH3 group. Leu249 amino acid forms hydrophobic interaction with CH3 group and thiazole ring. Met177 and Met174 amino acids form π-sulfur interaction with CH3 group. The docked ligand title compound forms a stable complex with adenosine receptor and gives a binding affinity (ΔG in kcal/mol) value of -7.8 (Table 6). These preliminary results suggest that the compound might exhibit inhibitory activity against adenosine receptor.
Conclusions
IR, Raman and UV-Vis spectra of 2-amino-5-ethyl-1,3,4- thiadiazole were reported in the present work. Using the Gaussian09 set of quantum chemistry codes, the vibrational frequencies were examined theoretically and the normal modes were assigned by potential energy distribution. A comparison of the hyperpolarizability indicates that the title compound may be a good candidate as a NLO material. The intense band in the UV range of the electronic absorption spectrum is observed at 250.4 nm, which is indicating the presence of chromophoric NH2 in the ring. The calculated HOMO and LUMO energies show the chemical activity of the molecule. From the molecular docking study, the ligand binds at the active site of the substrate by weak non-covalent interactions and the results suggest that the compound might exhibit inhibitory activity against adenosine receptor.
Acknowledgements
We are thankful to the Sophisticated Instrument Laboratory (SIL) of Dr. H. S. Gour University, Sagar, Madhya Pradesh for providing FT-IR and Laser-Raman instrumental facility. One of the authors Javeed Ahmad War would like to acknowledge the financial support from Department of Science and Technology, New Delhi, India under INSPIRE program (INSPIRE ID: IF120399).
References
- Vicini P, Geronikaki A, Anastasia K, Incerti M, Zani F (2006) Synthesis and antimicrobial activity of novel 2-thiazolylimino-5-arylidene-4-thiazolidinones. Bioorg Med Chem 14: 3859-3864.
- Chen H, Li Z, Han Y (2000) Synthesis and fungicidal activity against Rhizoctonia soladi of 2-alkyl(alkylthio)-5-pyrazolyl-1,3,4-oxadiazoles (Thiadiazoles). J Agric Food Chem 48: 5312-5315.
- Mullican MD, Wilson MW, Conner DT, Kostlan CR, Schrier DJ, Dyer RD (1993) Design of 5-(3,5-di-tert-butyl-4-hydroxyphenyl)-1,3,4-thiadiazoles, -1,3,4-oxadiazoles and -1,2,4-triazoles as orally active, nonulcerogenic antiinflammatory agents. J Med Chem 36: 1090-1099.
- Tehranchian S, Akbarzadeh T, Fazeli MR, Jamalifar H, Shafiee A (2005) Synthesis and antibacterial activity of 1-[1,2,4-triazol-3-yl] and 1-[1,3,4-thiadiazol-2-yl]-3-methylthio-6,7-dihydrobenzo[c]thiophen-4(5H)ones. Bioorg Med Chem Lett 15: 1023-1025.
- Srivastava SK, Srivastava S, Srivastava SD (2002) Synthesis of new 1,2,4-triazolo-thiadiazoles and its 2-oxoazetidines as antimicrobial, anticonvulsant and antiinflammatory agents. Ind J Chem 41: 2357-2363.
- Srivastava SK, Srivastava S, Srivastava SD (1999) Synthesis of new carbazolyl-thiadiazolyl-2-oxo-azetidines: Antimicrobial, anticonvulsant and antiinflammatory agents. Ind J Chem 38: 183-187.
- Oruç EE, Rollas S, Kandemirli F, Shvets N, Dimoglo AS (2004) 1,3,4-Thiadiazole derivatives, synthesis, structure elucidation and structure – Antituberculosis activity relationship investigation. J Med Chem 7: 6760–6767.
- Hokfelt B, Jonsson A (1962) Hypoglycemic activity in relation to chemical structure of a potential oral antidiabetic substances. III 2-benzenesultonamido-5-alkyl-1,3,4-thiadiazoles and –oxadiazoles. J Med Chem 5: 247–257.
- Rzeski W, Matysiak J, Szerszen MK (2007) Anticancer, neuroprotective activities and computational studies of 2-amino-1,3,4-thiadiazole based compound. Bioorg Med Chem 15: 3201–3207.
- Sherif EM, Park SM (2006) 2-amino-5-ethyl-1,3,4-thiadiazole as a corrosion inhibitor for copper in 3.0% NaCl solutions. Corrosion Sci 48: 4065-4079.
- Sherif EM, Park SM (2006) Effects of 2-amino-5-ethylthio-1,3,4-thiadiazole on copper corrosion as a corrosion inhibitor in aerated acidic pickling solutions. Electrochim Acta 51: 6556-6562.
- Bentiss F, Lebrini M, Lagrenée M, Traisnel M, Elfarouk A, Vezin H (2007) The influence of some new 2,5-disubstituted 1,3,4-thiadiazoles on the corrosion behaviour of mild steel in 1 M HCl solution: AC impedance study and theoretical approach. Electrochim Acta 52: 6865-6872.
- Lynch DE (2001) 2-Amino-5-methyl-1,3,4-thiadiazole and 2-amino-5-ethyl-1,3,4-thiadiazole. Acta Cryst 57C: 1201-1203.
- El-Azhary AA (1996) Vibrational analysis of the spectra of 1,3,4-oxadiazole, 1,3,4-thiadiazole, 1,2,5-oxadiazole and 1,2,5-thiadiazole: comparison between DFT, MP2 and HF force fields. Spectrochim Acta 52: 33-44.
- Obot IB, Obi-Egbedi NO (2009) HSAB descriptors of thiadiazole derivatives calculated by DFT: possible relationship as mild steel corrosion inhibitors. Der Pharma Chemica 1: 106-123.
- Gaussian (2010) Frisch MJ et al. Revision C.01 Gaussian, Inc., Wallingford CT.
- Foresman JB, Frisch E (1996) Exploring Chemistry with Electronic Structure Methods: A Guide to Using Gaussian, Pittsburg, PA.
- Dennington R, Keith T, Millam J (2009) Gaussview, Version 5, Semichem. Inc., Shawnee Missions, KS.
- Martin JML, Van Alsenoy C (2007) GAR2PED, A Program to Obtain A Potential Energy Distribution from a Gaussian Archive Record: University of Antwerp, Belgium.
- Roeges NPG (1994) A Guide to the Complete Interpretation of Infrared Spectra of Organic Compounds, Wiley, New York.
- Colthup NB, Daly LH, Wiberly SE (1990) Introduction to Infrared and Raman Spectroscopy, 3rd edn, Academic Press, Boston.
- Silverstein RM, Webster FX (2003) Spectrometric Identification of Organic Compounds, 6th edn, Wiley, Singapore.
- Haress NG, Al-Omary F, El-Emam AA, Mary YS, Panicker CY, et al. (2015) Spectroscopic investigation (FT-IR and FT-Raman), vibrational assignments, HOMO-LUMO analysis and molecular docking study of 2-(Adamantan-1-yl)-5-(4-nitrophenyl)-1,3,4-oxadiazole. Spectrochim Acta 135: 973-983.
- Mary YS, Panicker CY, Yamuna TS, Siddegowda MS, Yathirajan HS, et al. (2014) Theoretical investigations on the molecular structure, vibrational spectral, HOMO-LUMO and NBO analysis of 9-[3-(Dimethylamino)propyl]-2-trifluoro-methyl9H-thioxanthen-9-ol. Spectrochim Acta 132: 491-501.
- Minitha R, Mary YS, Varghese HT, Panicker CY, Ravindran R, et al. (2011) FT-IR, FT-Raman and computational sutdy of 1H-2,2-dimethyl-3H-phenothiazin-4[10H]-one. J Mol Struct 985: 316-322.
- Endredi CH, Billes F, Holly S (2003) Vibrational spectroscopic and quantum chemical study of the chlorine substitution of pyrazine. J Mol Struct Theochem 633: 73-82.
- Fukui K (1982) Role of frontier orbitals in chemical reactions. Science 218: 747-754.
- Parr RG, Chattaraj PK (1991) Principle of maximum hardness. J Am Chem Soc 113: 1854-1855.
- Parr RG, Szentpaly L, Liu S (1999) Electrophilicity index. J Am Chem Soc 121: 1922-1924.
- Parthasarathi R, Padmanabhan J, Subramanian V, Maiti B, Chattaraj P (2004) Toxicity analysis of 3,4,5-pentachloro biphenyl through chemical reactivity and selectivity profiles. Curr Sci 86: 535-542.
- Shen YR (1984) The Principles of Nonlinear Optics, Wiley, New York.
- Burland DM, Miller RD, Walsh CA (1994) Second order nonlinearity inpoled polymer systems. Chem Rev 94: 31-75.
- Adant M, Dupuis L, Bredas L (2004) Ab initio study of the nonlinear optical properties of urea, electron correlation and dispersion effects. Int J Quantum Chem 56: 497-507.
- Thul P, Gupta VP, Ram VJ, Tandon P (2010) Structural and spectroscopic studies on 2-pyranones. Spectrochim Acta 75: 251-260.
- Politzer P, Murray JS In: Beveridge DL, Lavery R (Eds.) (1991) Theoretical Biochemistry and Molecular Biophysics, A comprehensive Survey, protein, Vol. 2, Adenine Press, Schenectady, New York.
- Becke AD (1993) Density functional thermochemistry III. The role of exact exchange. J Chem Phys l 98: 5648-5682.
- Glendening ED, Reed AE, Carpenter JE, Weinhold F (2003) NBO Version 3.1, Gaussian Inc., Pittsburgh, PA.
- Fredholm BB, Ijzerman AP, Jacobson KA, Klotz KN, Linden J (2001) International Union of Pharmacology. XXV. Nomenclature and classification of adenosine receptors. Pharmacol Rev 53: 527-552.
- Fredholm BB, Ijzerman AP, Jacobson KA, Linden J, Muller CE (2011) Internationl Union of Basic and Clinical Phamacology. LXXXI. Nomenclature and classification of adenosine receptors – an update. Pharmacol Rev 63: 1-34.
- Chen JF, Eltzschig HK, Fredholm BB (2013) Adenosine receptors as drug targets- what are the challenges. Nat Rev Drug Disc 12: 265-286.
- Goblyos A, Ijzerman AP (2011) Allosteric modulaton of adenosine receptors. Biochim Biophys Acta 1808: 1309-1318.
- Aurelio L, Christopoulos A, Flynn BL, Scammells PJ, Sexton PM, et al. (2011) The synthesis and biological evaluation of 2-amino-4,5,6,7,8,9-hexahydrocycloocta[b]thiophenes as allosteric modulators of the A1 adenosine receptor. Bioorg Med Chem Lett 21: 3704-3707.
- Scheiff AB, Yerande SG, El-Tayeb A, Li W, Inamdar GS, et al. (2010) 2-Amino-5-benzoyl-4-phenylthiazoles: Development of potent and selective adenosine A1 receptor antagonists. Bioorg Med Chem 18: 2195-2203.
- Inamdar GS, Pandya AN, Thakar HM, Sudarsanam V, Kachler S, et al. (2013) New insight into adenosine receptors selectivity derived from a novel series of [5-substituted-4-phenyl-1,3-thiazol-2-yl] benzamides and furamides. Eur J Med Chem 63: 924-934.
- Cagide F, Borges F, Gomes LR, Low JN (2015), Synthesis and characterisation of new 4-oxo-N-(substituted-thiazol-2-yl)-4H-chromene-2-carboxamides as potent adenosine receptor ligands. J Mol Struct 1089: 206–215.
- Pandya DH, Sharma JA, Jalani HB, Pandya AN, Sudarsanam V, et al. (2015) Novel thiazole-thiophene conjugates as adenosine receptor antagonists: Synthesis, bilogical evaluation and docking studies. Bioorg Med Chem Lett 25: 1306–1309.
- Trott O, Olson AJ (2010) AutoDock Vina: Improving the speed and accuracy of docking with a new scoring function, efficient optimization and multithreding. J Comput Chem 31: 455-461.
- Kramer B, Rarey M, Lengauer T (1999) Evaluation of the FlexX incremental construction algorithm for the protein-ligand docking. Proteins: Struct Funct Genet 37: 228-241.
Open Access Journals
- Aquaculture & Veterinary Science
- Chemistry & Chemical Sciences
- Clinical Sciences
- Engineering
- General Science
- Genetics & Molecular Biology
- Health Care & Nursing
- Immunology & Microbiology
- Materials Science
- Mathematics & Physics
- Medical Sciences
- Neurology & Psychiatry
- Oncology & Cancer Science
- Pharmaceutical Sciences
