Growth and Characterization of Pure and Cesium - Doped L - Asparagine Monohydrate Single Crystals
Kathiravan P, Balakrishnan T
Kathiravan P and Balakrishnan T*
Crystal Growth Laboratory, PG and Research, Department of Physics, Periyar EVR College (Autonomous), Tiruchirappalli, Tamil Nadu, India
- *Corresponding Author:
- Balakrishnan T
Crystal Growth Laboratory, PG and Research, Department of Physics, Periyar EVR College (Autonomous), Tiruchirappalli-620 023, Tamil Nadu, India
Tel: +91–9443445535
E-mail: balacrystalgrowth@gmail.com
Received Date: November 30, 2015, Accepted Date: November 30, 2015, Published Date: November 30, 2015
Abstract
Single crystal of pure and doped L – Asparagine monohydrate (LAM) was successfully grown by slow evaporation method at room temperature. Transparent, bulk single crystals of size of 10 × 4 × 4 mm3 were harvested in ten days. The lattice parameters were calculated by single crystal X – ray diffraction. The effect of Cs - doping on the growth, optical and microhardness properties has been investigated. The presence of functional groups have been assigned by FTIR spectral analysis. UV – Vis – NIR spectrum was recorded to study the optical transmittance and absorbance of grown crystal. The dielectric behaviour of the crystals was also studied. The thermal properties of pure and Cs – doped LAM crystals were investigated by thermo gravimetric, differential thermal analysis and differential scanning calorimetry analyses. Chemical etch study was carried out using optical microscopy to study the dislocation, surface defects and morphology.
Keywords
Crystal growth; X -ray diffraction; Micro hardness; Dielectric studies; Thermal analysis
Introduction
The search and design of highly efficient nonlinear optical (NLO) crystals for visible and ultraviolet (UV) region are extremely important for laser processing. In view of this, it is desired to find new NLO crystals which have a shorter cut-off wavelength. High quality organic NLO crystals must possess sufficiently large NLO coefficient, transparent in UV region and high laser damage threshold power and easily grown with large dimensions [1]. Among the biological molecules, asparagine is a very important amino acid because it plays a role in the metabolic control of some cell functions in nerve and brain tissue and is also used by many plants as a nitrogen reserve source [2]. Amino acid family of crystals are under extensive investigations in recent times owing to their favourable nonlinear optical properties [3,4]. The structure of L – asparagine monohydrate has been discussed several times [5]. Verbist have reported that L - Asparagine monohydrate (LAM) single crystal crystallizes in orthorhombic structure [6] and belong to P212121 space group with four molecules per unit cell. Its lattice parameters are a=5.597 Å, b=9.819 Å, c=11.792 Å and V=648.05 Å3. The molecule is in the zwitter ionic form and is linked together by seven distinct hydrogen bonds forming a three dimensional network. Several metal, organic and inorganic acid were complexed with LAM crystals have been synthesized and reported, which gives as hope to synthesize new complexes. Asparagine complexes such as L – asparagine – L - tartaric acid (LALT) [7], L - asparaginium picrate (LASP) [8], L - asparaginium nitrate (LAsN) [9] and L - asparagine cadmium chloride monohydrate [10] are proved to be good NLO materials. Recently, investigation of Mn2+ doped L - asparagine monohydrate single crystal has been found to improve the crystallinity, optical transparency and mechanical strength that are useful for optoelectronic application as reported by Shakir et al. [11]. In view of this we have undertaken the growth and characterization of pure and Cs doped LAM crystals. In this work, we have presented the growth, structural, optical, thermal, mechanical, dielectric and etching of Pure Cs - doped LAM single crystals grown by slow evaporation method.
Experimental
Crystal growth
Analar grade L – Asparagine monohydrate and Cesium nitrate salts were used to grow the single crystals. Saturated solution of L – Asparagine monohydrate was prepared at room temperature. The solution was continuously stirred for about six hours using the magnetic stirrer and this solution was filtered using whatman filter paper. The filtered solution was kept in a dust free atmosphere to allow evaporation. Good quality single crystals of pure LAM is harvested after the growth period of 11 days. The size of the grown LAM crystal 5 × 3 × 3 mm3 is shown in Figure 1 (a). The growth of Cs – doped LAM crystals were successfully grown by slow evaporation technique. Saturated solution of AR grade LAM and one mole percentage of CsNO3 was prepared. The prepared solution was filtered and placed in an undisturbed area. The Cs – doped LAM single crystals of size 10 × 4 × 4 mm3 were harvested after the growth period of seven days is shown Figure 1 (b).
Results and Discussion
Single crystal X-ray diffraction
In order to identify the lattice parameters of the grown crystals, single crystal X-ray diffraction study was performed by using ENRAF – NONIUS CAD 4 diffractometer with CuKα radiation source (λ=1.5404 Å). The single crystal XRD data shows that both pure and Cs - doped LAM crystals belongs to orthorhombic crystallographic system. The lattice parameters of LAM crystals are in good agreement with the reported values [5]. The observed lattice parameter values of the pure and Cs – doped LAM crystals were compared and is presented in Table 1. A marginal decrease in the lattice parameters and volume has been observed for the Cs – doped LAM crystal in comparison with the pure LAM crystal.
FT-IR analysis
The FT - IR spectrum of pure and Cs - doped LAM crystals were recorded on Perkin - Elmer FTIR spectrometer using KBr pellet technique in the range of 4000 - 400 cm-1. The FTIR spectra of both pure and Cs - doped LAM crystals are shown in Figure 2. A peak appeared at 3781 cm-1 indicating the presence of O - H stretching vibration. The intense and fairly sharp band at 3383 cm-1 is assigned to the NH2 asymmetric stretching vibration. The appearance of the broad band at 3110 cm-1 is due to the NH2 symmetric stretching vibration. The N – H symmetric stretching vibration is observed in 2000 cm-1. The asymmetric and symmetric stretching type vibration of ionised carboxylate group COO- are observed at 1642 cm-1 and 1430 cm-1 respectively. The band observed at 1358 cm-1 is assigned to CH2 twisting type of vibration. The band at 1148 cm-1 is attributed to the rocking type of vibration of NH3. The band corresponding to C-N and C-C stretching vibrations appeared at 1083 and 836 cm-1 respectively. The of vibrational peak observed at 597 and 511 cm-1 are due to torsional oscillation of NH3+. Although the spectrum of Cs - doped LAM provides similar features as that of pure LAM, there is slight shifting observed suggesting that it may be due to the incorporation of Cs ions in the lattice of LAM.
EDAX analysis
Energy Dispersive X - rays Analysis (EDAX) is a technique used for identifying the elemental composition of the specimen. In this study, the grown crystals were analyzed by FEI QUANTA 200F energy dispersive X – ray microanalyzer. The incorporation of Cs in the doped specimen was confirmed by EDS qualitative analysis as clearly seen in Figure 3. Analysis of the surface at different sites reveals that the incorporation of Cs is non-uniform over the host crystal surface.
UV-Vis - NIR Spectral studies
UV – Vis – NIR transmittance Spectrum of pure and Cs – doped LAM single crystal of thickness 2 mm was recorded in the wavelength range 200 - 1100 nm using Lambda 35 UV – Vis – NIR spectrophotometer. It gives limited information about the structure of the molecule because the transmittance of UV and Visible light involves promotion of the electrons from the ground state to a higher energy state. A nonlinear optical material can be used for practical application only if it has a wide transparency window. Figure 4 shows the transmittance spectrum of pure and Cs - doped LAM single crystals. The lower cut-off wavelength is found to be at 196 nm and 221 nm for pure and Cs - doped LAM respectively. LAM crystal has good optical transparency in the complete UV - visible region. Whereas the percentage of optical transmittance decreases slightly for Cs - doped LAM. Absorption in the near ultraviolet region arises from electronic transitions associated within the sample. The optical absorption coefficient (α) was calculated from the transmittance spectrum using the following relation,

Where, T is the transmittance and t is the thickness of the crystal. Owing to the direct band gap, the crystal under study has an absorption coefficient (α) obeying the following relation for high photon energies (hυ),

Where, Eg is optical band gap energy of the crystal and A is a constant. The plot of (αhυ)2 versus hυ is shown in Figure 5. Eg is evaluated by the extrapolation of the linear part of the graph with x-axis. The calculated band gap energy is found to be 6.3 eV for pure LAM and Cs – doped LAM is 6.1 eV.
Dielectric studies
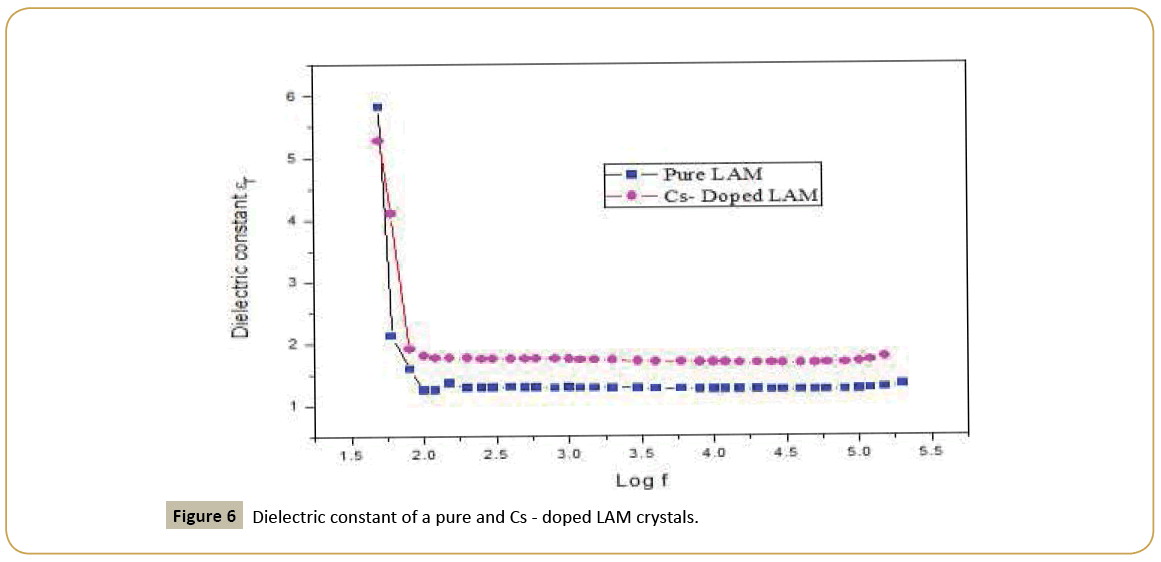
The dielectric study of pure and Cs – doped LAM single crystals were carried out using the instrument HIOKI 3532 - 50 LCR HITESTER. A sample of dimension 4 × 2 × 2 mm3 having graphite coating on the opposite faces was placed between the two copper electrodes and thus a parallel plate capacitor was formed. The capacitance of the sample was measured by varying the frequency from 50 Hz to 200 KHz at room temperature. Figure 6 Shows the variation of the dielectric constant (εr) with applied frequency. The dielectric constant is calculated using the formula
εr = Ct/ε0A
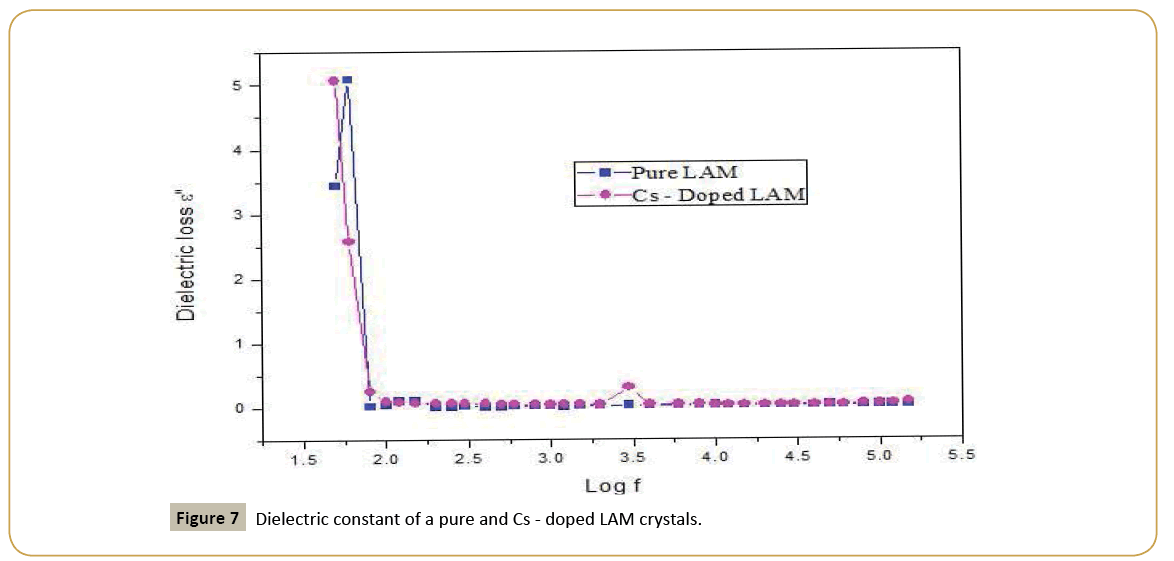
Where C is capacitance (F), t the thickness (m), A the area (m2), ε is the absolute permittivity in the free space having a value of 8.854 × 10⁻¹² Fm-1. The dielectric constant has high value in the lower frequency region and then it decreases with increase of frequency. The high value of dielectric constant at low frequencies may be due to the presence of all the four polarizations and its low value at high frequencies may be due to the loss of significance of these polarizations gradually [12]. Similarly, the variation of dielectric loss with frequency is shown in Figure 7. In the case of Cs – doped LAM the same trend is observed with reference to pure LAM. However it is marginally altered in the dielectric behaviour of pure LAM, which may be due to the incorporation Cs metal ion dopant. It is confirmed that the grown crystals possesses optical quality with fewer defects, and this parameter is vital importance role for various second harmonic generation application.
Vicker’s microhardness studies
Mechanical strength is one of the important properties of any material used for device fabrication. Hardness is the resistance offered by a material against the plastic deformation caused by scratching or indentation. The Vickers microhardness measurements were carried out on pure and Cs – doped LAM crystal using SHIMADZU HMV - 2000 microhardness tester. The static indentation were made at room temperature with a constant indentation time 3 s. The diagonal impressions of the indentation marks made on the surface by varying load from 25 g to 100 g were measured. To get accurate measurements for microhardness values at each load the experiment was repeated and the average value of diagonal length of indentation for pure and Cs - doped LAM crystals were calculated. The hardness was calculated using the following expression:

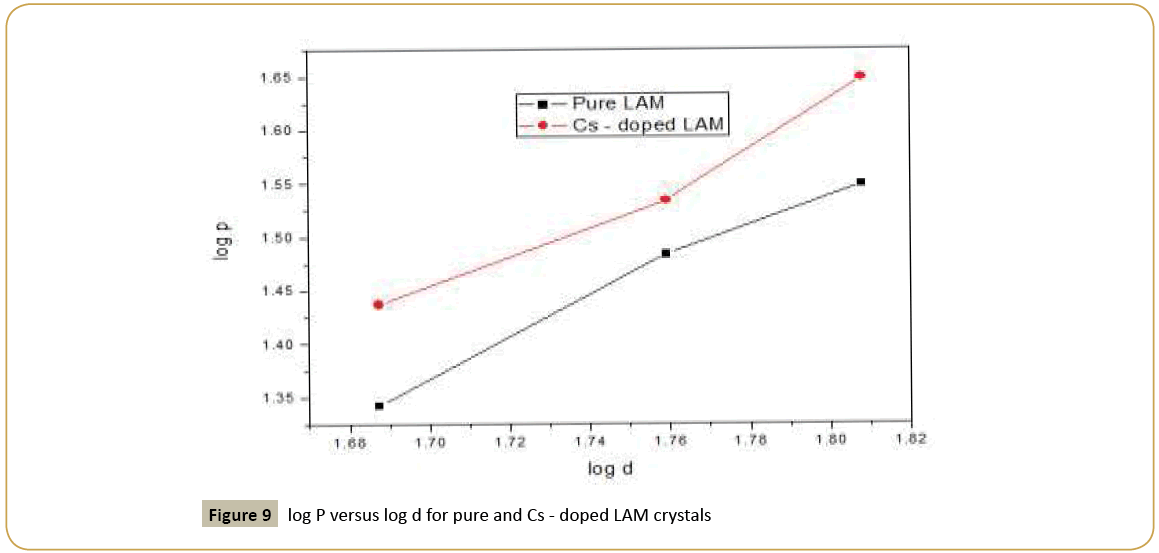
where P is applied load in kg, 1.8544 is a count of a geometrical factor for the diamond pyramidal indenter and d is the average diagonal length of the indenter impression in mm. The hardness number was found to increase with increase in applied load and above 100 g cracks were developed on the smooth surface of the crystal due to the release of internal stress generated locally by indentation. The microhardness (Hv) values increases with load for both pure and cesium doped L-Asparagine monohydrate. From the results, it is observed that the value of hardness of the pure LAM crystal is higher than the hardness value of Cs - doped LAM single crystals for all loads. This decrease in the hardness value of doped sample can be attributed to the incorporation of the impurity in the lattice of the LAM crystal. The plot drawn between the corresponding loads and hardness values of pure and Cs – doped LAM is depicted in Figure 8. The hardness value of the material increases with the increase of applied load. Such a phenomenon was referred to as reverse indentation size effect (RISE). In order to analyze the ISE one needs to fit the experimental data according to the Meyer’s law
P = Adn
which correlate the applied load P and indentation length d. Where A is a constant parameter for a given material n is called the Meyer’s index or work hardening coefficient. In the present work the plot obtained between log P and log d. The work hardening coefficient (n) was calculated from Figure 9 by the least square curve fitting method. The work hardening coefficient (n) was calculated to be 1.2 for pure LAM and 1.1 for Cs – doped LAM respectively. According to Onitsch [13], the value of n lies between 1 and 1.6 for hard materials and for soft material if is above 1.6. So the crystal pure and Cs – doped LAM can be accepted as hard material.
Thermal analysis
The Thermogravimetry (TG), differential thermal analysis (DTA), and differential scanning Calorimetry (DSC) techniques were employed to identify the phase transition, different stages of decomposition and melting point of the grown crystals. The TGA and DTA of pure and doped LAM crystals were carried out in nitrogen atmosphere in the temperature range 25°C - 1000°C, at a heating rate of 10°C, using the instrument SDT Q600 V20.9 Build 20 analyzer. Figures 10 and 11 show the simultaneously recorded TGA, DTA and DSC curves of pure and Cs - doped L-Asparagine monohydrate crystals. TGA curve shows three stages of weight loss for pure Cs-doped LAM. The compound is stable upto 106°C. The first stage of decomposition between 106°C and 233°C is about 11% due to the evaporation of lattice water. The second stage is between 283°C and 342°C with a weight loss of 25% due to the decomposition L-Asparagine. The third weight loss upto 900°C is about 27% is due to the decomposition of remaining residue which is up to 900°C.
From DTA curve of pure L – Asparagine shows a strong endothermic peak at 120.68°C and 257.16°C. The endothermic peaks of Cs doped LAM crystals are slightly shifted and observed at 125.96°C and 256.97°C. The two endothermic peaks in pure and Cs-doped LAM coincides exactly with the decomposition patterns observed in TGA. From the analysis it is concluded that the crystal decomposes before melting. DSC curve of both pure and Cs Doped LAM crystal shows three phase transition. The peaks of doped LAM crystal are slightly lower in value and shifted accordingly. This supports the fact of incorporation of Cs ion in the host crystal [14]. There is a reduction in the decomposition temperature of the doped crystal which is attributed to the decreased lattice energy caused by the addition of metal ion [15].
Etching analysis
Etching is a technique used to reveal the defects in crystals like dislocations, twin boundaries and point defects etc. Normally when the crystal is dissolved in the solvent, well defined etch pits are formed. The formation of the etch pit is assumed to be the reverse of growth process. The etching studies were carried out on the grown crystals of pure and doped LAM crystals using polarized High resolution optical microscope. The surface of the crystal was polished finely before the etching process. The photographs were taken with an etching time of 10 seconds for pure and 20 seconds for Cs doped LAM crystals the etch patterns are shown in Figure 12 (a) and (b). The etching shows predominant straight striations on the grown crystal. The size of the pit increases with the increase of etching time. The pit pattern remains the same. The observed etch pits are due to the layered growth of the crystal. This shows how the crystal would have been formed from the solution [16].
Conclusions
The single crystals of pure and Cs - doped L - Asparagine monohydrate single crystals were grown from aqueous solution by slow evaporation technique at room temperature. The grown crystals are transparent and have well defined external appearance. Single crystal X – ray diffraction studies confirm that both pure and Cs - doped LAM crystals crystallize in orthorhombic crystal system. The UV cut - off wavelength of pure LAM and Cs - doped LAM is observed at 196 nm and 221 nm respectively. The FTIR spectrum confirms that the presence of functional groups of the grown single crystals. The incorporation of Cs metal ion in the LAM crystal is confirmed by EDAX spectral analysis. The dielectric studies reveals that the value of dielectric constant and dielectric loss of the crystal is low at high frequency region. The microhardness study indicate that the hard nature of the crystals. It is interesting to note that the incorporation of dopant have slightly improved the hardness of the parent. Etch patterns of grown Cs - doped LAM crystal shows the crystalline perfection.
References
- Yogam F, Vetha Potheher I, Jeyasekaran R, Vimalan M, Antony Arockiaraj M, et al. (2013) Growth, thermal and optical properties os L-asparagine monohydrate NLO single crystal. J Therm Anal Calorim 114: 1153-1159.
- Lund P (1981) Nitrogen Metabolism in Mammalian. Applied Science, Barking.
- Joseph Arul Pragasam A, Selavakumar S, Madhavan J, Prem Anand D, Sagayaraj P (2005) Effect of metallic substitution on the optical, mechanical and photo conducting properties of L-arginium diphosphate single crystals. Int J Pure & Appl Phys 43: 463.
- Alosous Gonsago C, Helen Merina Albert, Umamaheswari R, Joseph Arul Pragasam A (2012) Effect of Urea Doping on Spectral, optical and thermal Properties of L-Histidine crystals. J Therm Anal Calorim 110: 839-845.
- Kartha G, Vries DE (1961) Structure of Asparagine. Nature 192: 862.
- Verbist JJ, Lehman MS, Koetzla TF, Hamilton WC (1972) The Crystal and Molecular Structure of the Amino Acid L- Asparagine Monohydrate. Acta Cryst B 28: 3006.
- Moovendaran K, Bikshandarkoil Srinivasan R, Kalyana Sundar J, Martin Britto Dhas SA, Natarajan S (2012) Structural, vibrational and thermal studies of a new nonlinear optical material: L-Asparagine ? L- tartaric acid. Spectrochimica Acta Part A 92: 388-391.
- Srinivasan P, Kanagasekaran T, Gopalakrishnan R, Bhagavannarayana G, Ramasamy P (2006) Studies on the Growth and Characterization of L-Asparaginium Picrate (LASP) A Novel Nonlinear Optical Crystal. J Cryst Growth & Design 6: 1663.
- Masilamani S, Tamilarasan K (2013) Synthesis, growth and characterization of L-Asparagine cadmium bromide A novel semiorganic nonlinear optical single crystal. Optik 124: 4303-4306.
- Masilamani S, Ilayabarathi P, Maadeswaran P, Chandrasekaran J, Tamilarasan K (2012) Synthesis, growth and characterization of a novel semiorganic nonlinear optical single crystal: L-Asparagine cadmium chloride monohydrate. Optik 123: 1304-1306.
- Shakir MD, Ganesh V, Wahab MA, Bhagavannarayana G, Kishan Rao K (2010) Structural, optical and mechanical studies on pure and Mn2+ doped L-Asparagine monohydrate single crystals. Mater Sci Engi B 172: 9-14.
- Peeresy N, Souhassouyx M, Wynckey B, Avoilleyx G, Coussonzand A (1997) Neutron diffraction study of the paraelectric phase of ammonium dihydrogen phosphate (ADP): hydrogen bonding of NH4+. J Phys Condens Matter 9: 6555.
- Onitsch E (1947) Uber die Microharte der metalle. Mikroscopie 2: 131-151.
- Muthu K, Rajasekar M, Meena K, Mahadevan CK, Meenakshisundaram SP (2012) Optical, thermal and dielectric properties of Sr(II)-doped bis (thiourea)zinc(II) chloride crystals. Spectrochimica Acta Part A 96: 825.
- Praveen Kumar P, Manivannan V, Tamilselvan S, Senthil S, Victor Antony Raj, Sagayaraj P, Madhavan J (2008) Growth and characterization of a pure and doped nonlinear optical L-histidine acetate single crystals. Opt Commun 281: 2989.
- Sangwal K (1987) Defects in Solids. North Holland Publishing Company, Netherlands. p: 15.
Open Access Journals
- Aquaculture & Veterinary Science
- Chemistry & Chemical Sciences
- Clinical Sciences
- Engineering
- General Science
- Genetics & Molecular Biology
- Health Care & Nursing
- Immunology & Microbiology
- Materials Science
- Mathematics & Physics
- Medical Sciences
- Neurology & Psychiatry
- Oncology & Cancer Science
- Pharmaceutical Sciences


